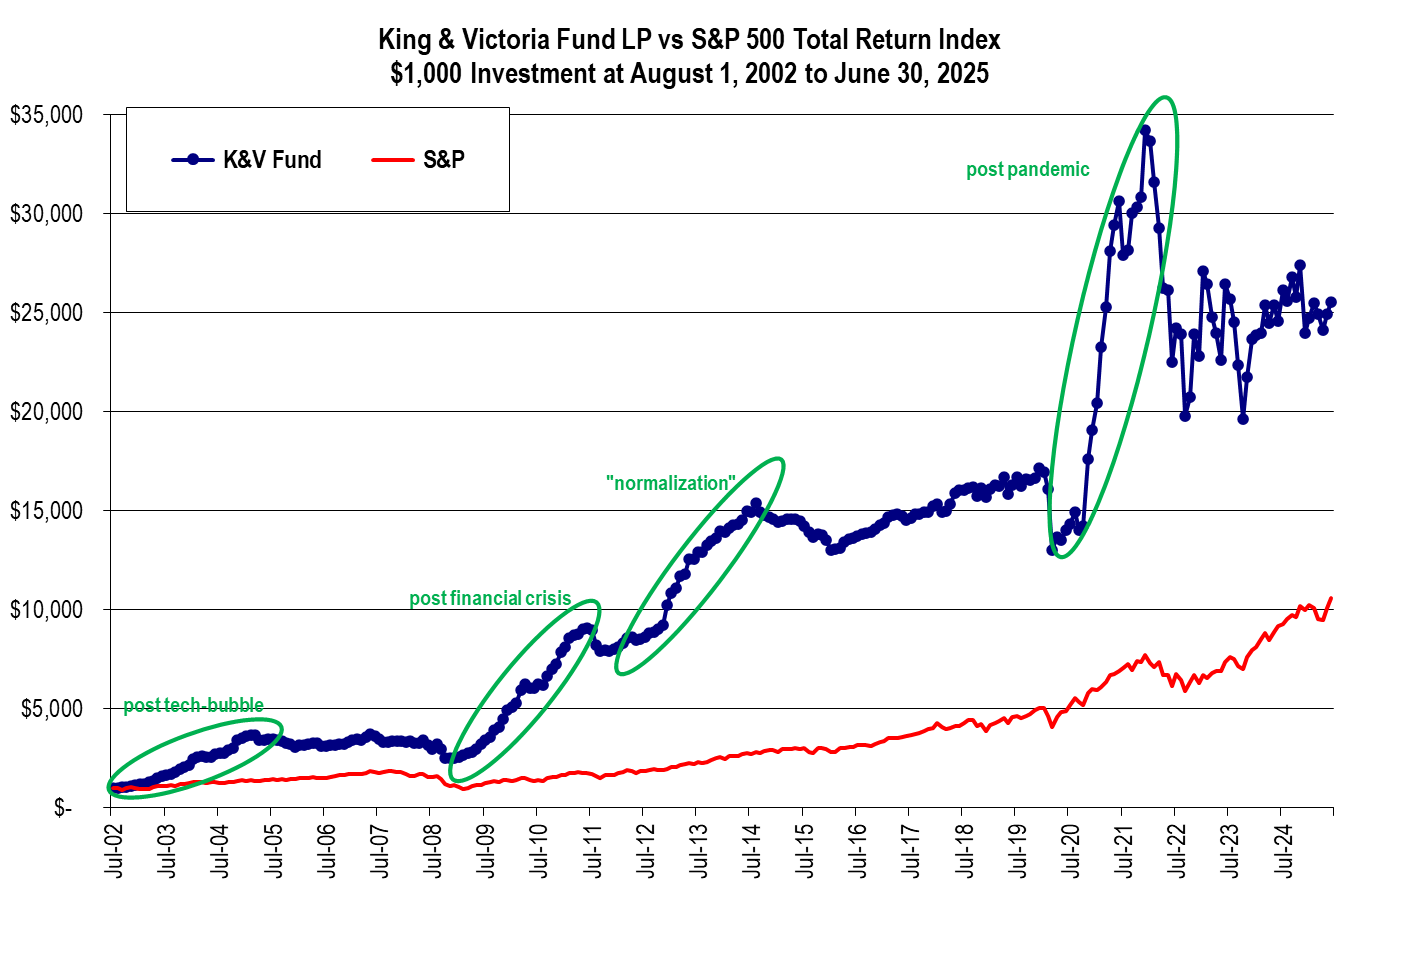
King & Victoria Fund L.P. vs S&P 500 Total Return Index
Note: X-Axis dates are month-end dates (for example: Jul-02 = July 31, 2002)
Rates of return are historical compounded total returns net of all fees and expenses. Investment in the King & Victoria Fund L.P. (“the Fund”) is not guaranteed and past performance is not necessarily indicative of future performance.
The benchmark shown is for illustrative and information purposes only. The S&P 500 Total Return Index is similar to the Fund in that both include publicly traded North American equities of various market capitalizations across industries and reflect movements in stock prices as well as reinvestment of dividend income. However, there are differences between the Fund and the indices as the Fund can invest in a cross section of securities including common shares, preferred stock, corporate debt instruments (including bank debt), convertibles, options and other derivatives; can invest both long and short; and can take concentrated positions in single equities up to a maximum of 20% of the Fund’s equity. Also, the indices do not include any fees or expenses whereas the Fund’s returns are net of all fees and expenses. The source of the benchmark data is Bloomberg and calculated by Equilibrium Capital Management Inc.
Partnership formed on July 4, 2002.